Python, matplotlibでワイブルプロットを描いてみる
ここではPythonのグラフ描画用ライブラリ matplotlib でワイブルプロットを描いてみます。この記事内ではワイブルプロットについて細かな説明はしません。実行したときにワイブルプロットが出てくるプログラムについて解説します。
例えばこんな方にお薦め
- Pythonでワイブルプロットを描きたい。
- Ftを併記したい。
前準備として、numpy, matplotlib ライブラリのインストールは済んでいるとします。
使用するソースコード
以下の公開リポジトリに置いています。
https://github.com/sunset-create/weibull
コードの解説
解説には下記のコードを使います。
import numpy as np
import matplotlib.pyplot as plt
import os

working_path = os.getcwd()

os.chdir(working_path)

time = '30,25,40'
x_str = time.split(',')

x_sort = list(map(float, x_str))

x = np.sort(x_sort)


x_i = 0
for i in x:
    x_i += 1

Ft = [(i - 0.3)/(x_i + 0.4) for i in range(1, x_i + 1)]
y = [np.log(np.log(1/(1-i))) for i in Ft]
log_x = [np.log(i) for i in x]
linear = np.polyfit(log_x, y, 1)
x_2 = np.append(0.1, 10000)
log_x_2 = [np.log(i)for i in x_2]
y2_linear = [linear[0] * x_linear2 + linear[1] for x_linear2 in log_x_2]

fig = plt.figure()
plt.xscale("log")
plt.xlim([1, 10000])
plt.ylim([-7, 2])
plt.scatter(x, y, color='black', marker='s')
plt.plot(x_2, y2_linear)
plt.xlabel('X')
plt.ylabel('Y')
plt.grid(which='major', color='black', linestyle='-')
plt.grid(which='both')
plt.grid(which='minor', color='black', linestyle='-')
plt.grid()

x = [0.1, 0.15, 0.2, 0.3, 0.4, 0.5, 1, 1.5, 2, 3, 4, 5, 10, 15, 20, 25, 30, 40, 50, 60, 70, 80, 90, 95, 99, 99.8, 99.9]
ya = []
for i in x:
    ya.append(np.log(np.log(1/(1-i/100))))

a = 0

for i in x:
    xa = 10000
    s = i
    plt.text(xa, ya[a], s)
    plt.plot(x_2, [ya[a], ya[a]], color='black', linewidth=0.5)
    a += 1

fig.savefig(working_path + "\\" + "weibull.png")

plt.show()
コードの解説をしていきます。
import numpy as np
import matplotlib.pyplot as plt
import os
numpy, matplotlib, osをインポートします。numpyは対数計算を実施するのに使用します。matplotlibはグラフを描画するのに使用します。
working_path = os.getcwd()
os.chdir(working_path)
現在のディレクトリを取得して、移動します。
time = '30,25,40'
x_str = time.split(',')
x_sort = list(map(float, x_str))
x = np.sort(x_sort)
故障時間をtime変数へ代入します。仮に'30,25,40'と入力しましたが、ここに","(カンマ)区切りで数値を入力することで任意のワイブルプロットを作成することが可能になります。また、ソート処理を行っていますので、大小が順番に並んでいる必要はありません。
x_i = 0 for i in x: x_i += 1
故障時間のデータ数をカウントしています。
Ft = [(i - 0.3)/(x_i + 0.4) for i in range(1, x_i + 1)]
y = [np.log(np.log(1/(1-i))) for i in Ft]
log_x = [np.log(i) for i in x]
linear = np.polyfit(log_x, y, 1)
x_2 = np.append(0.1, 10000)
log_x_2 = [np.log(i)for i in x_2]
y2_linear = [linear[0] * x_linear2 + linear[1] for x_linear2 in log_x_2]
ワイブルプロットへ記載記載するためにデータを加工しています。また、近似直線もここで用意しています。累積故障頻度の計算にはメジアンランクを使用しています。
fig = plt.figure()
plt.xscale("log")
plt.xlim([1, 10000])
plt.ylim([-7, 2])
plt.scatter(x, y, color='black', marker='s')
plt.plot(x_2, y2_linear)
plt.xlabel('X')
plt.ylabel('Y')
plt.grid(which='major', color='black', linestyle='-')
plt.grid(which='both')
plt.grid(which='minor', color='black', linestyle='-')
plt.grid()
matplotlibを使って、先に加工したデータをプロットしていきます。
x = [0.1, 0.15, 0.2, 0.3, 0.4, 0.5, 1, 1.5, 2, 3, 4, 5, 10, 15, 20, 25, 30, 40, 50, 60, 70, 80, 90, 95, 99, 99.8, 99.9]
ya = []
for i in x:
ya.append(np.log(np.log(1/(1-i/100))))
a = 0
for i in x:
xa = 10000
s = i
plt.text(xa, ya[a], s)
plt.plot(x_2, [ya[a], ya[a]], color='black', linewidth=0.5)
a += 1
ワイブルプロットへF(t)を併記するための前処理と、ワイブルプロットへのF(t)の記載を行っています。テキストとして記載しました。
fig.savefig(working_path + "\\" + "weibull.png")
描画したワイブルプロットを画像データとして保存します。
plt.show()
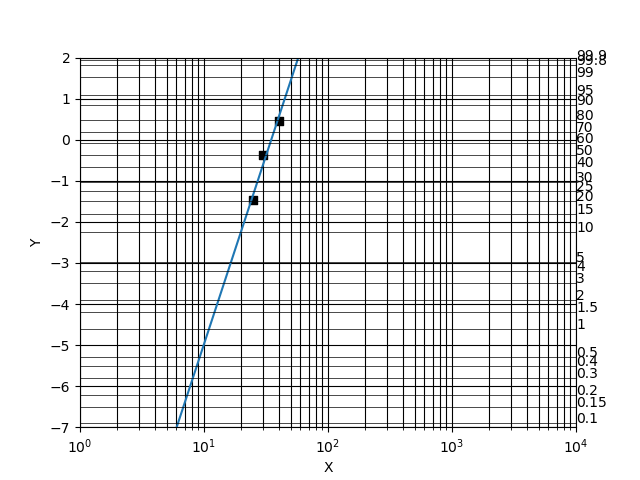
プログラムを実行すると、下のようなワイブルプロットが出てきます。プログラム中で入力した3点(25,30,40)の点に■が、その3点の近似直線が水色で引かれています。更に、F(t)の値がグラフ右側に追加され横線で描かれています。この近似直線とF(t)の線の交点を読めば各時間における故障確率を確認することができるようになっています。

今回は、Python, matplotlibを使ってFtを併記したワイブルプロットを描画してみました。